
2024 March Stats


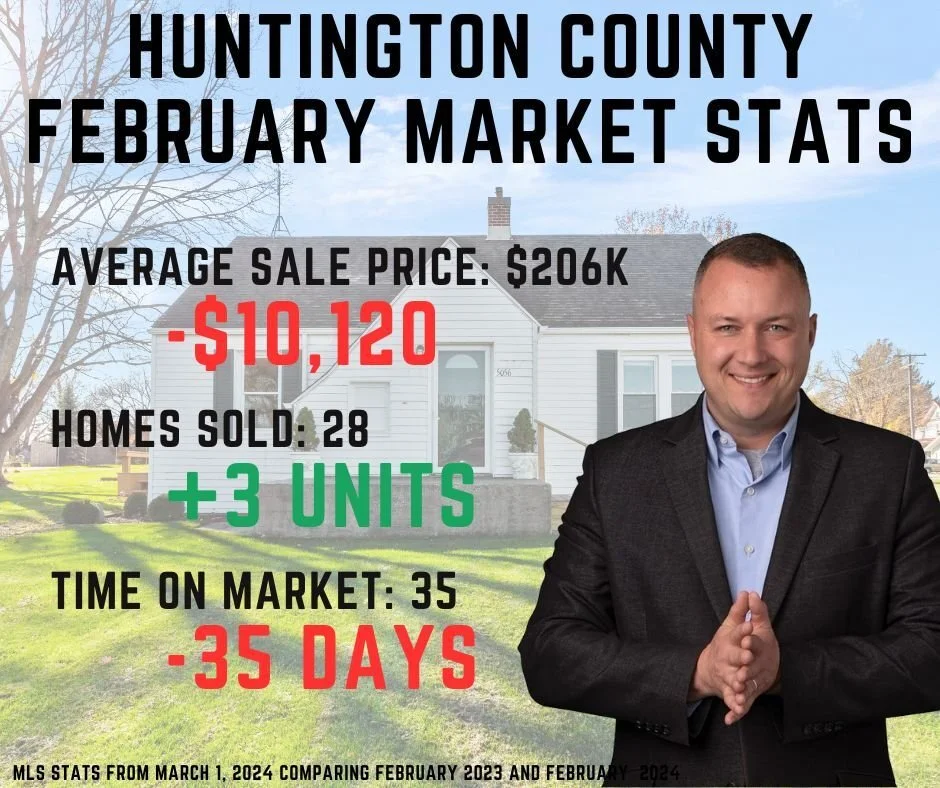
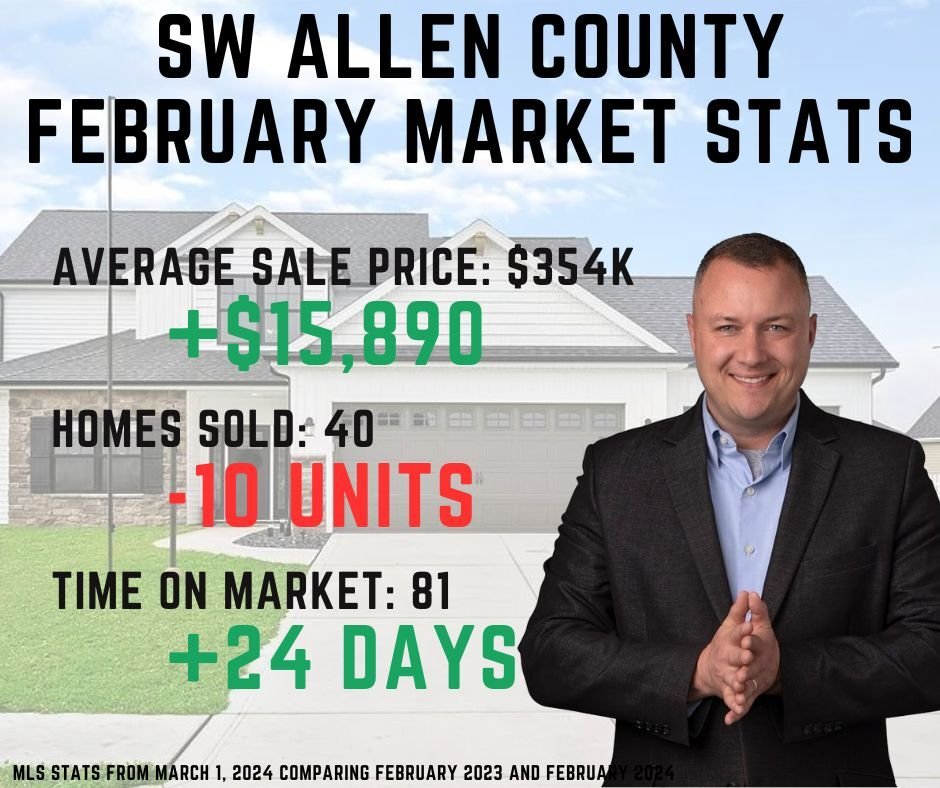
2024 February Stats

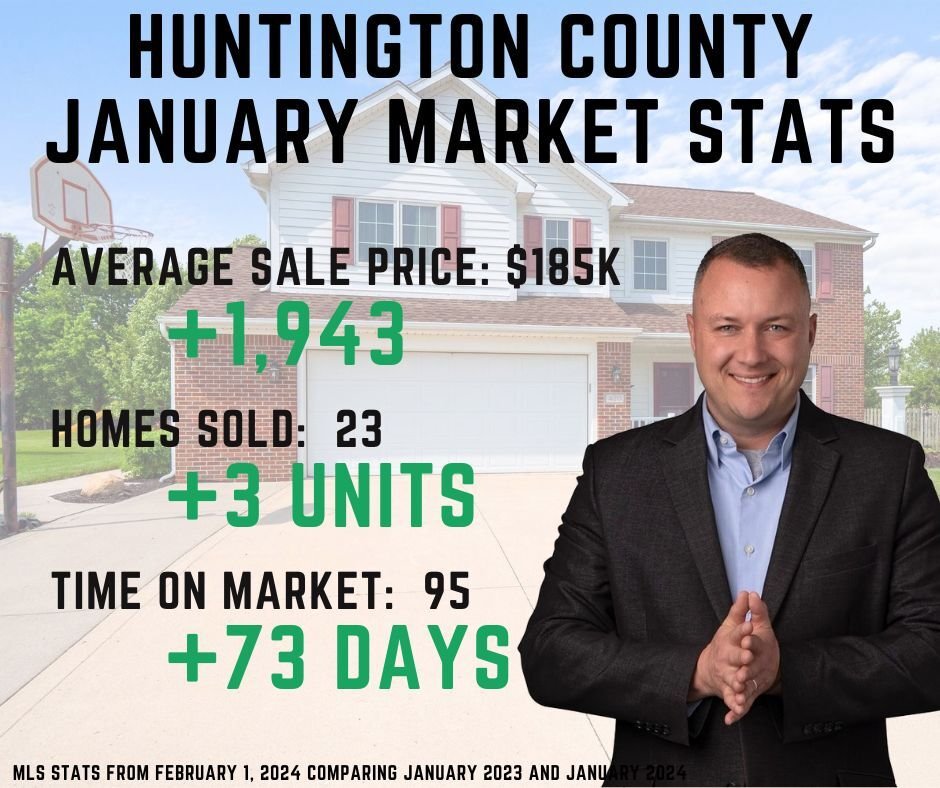
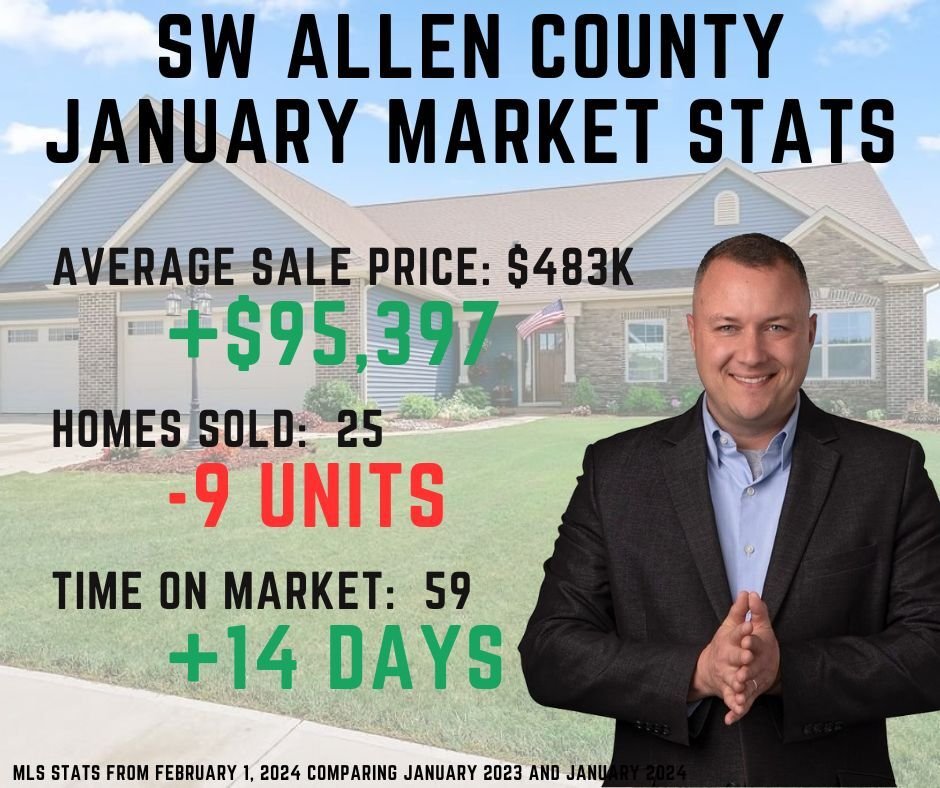
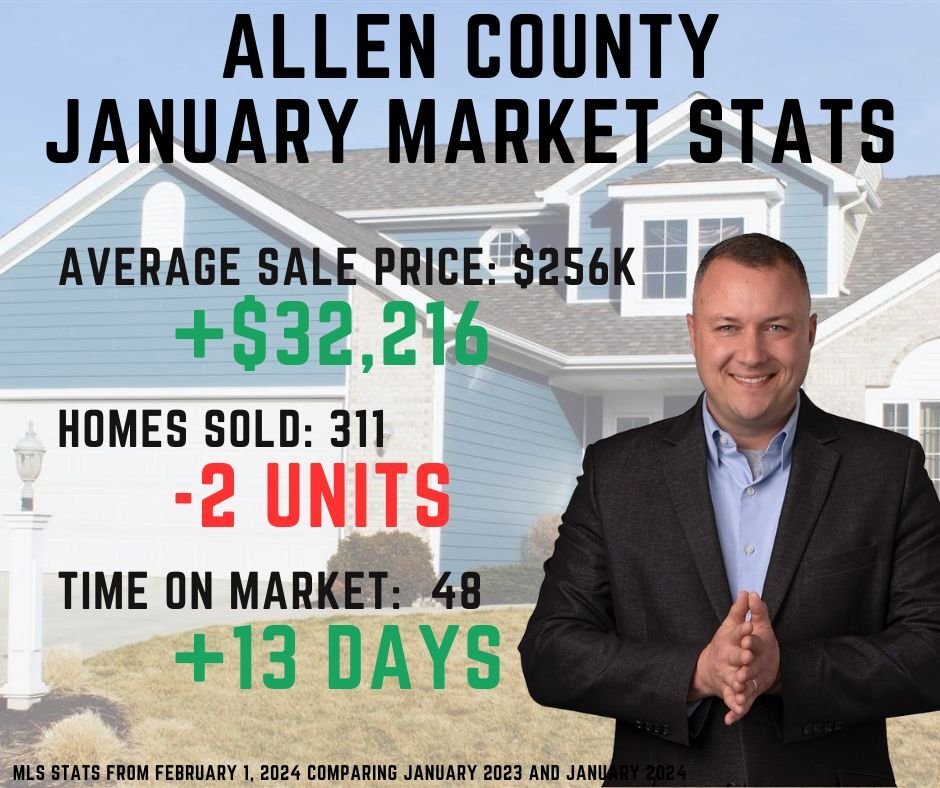
2024 January Stats
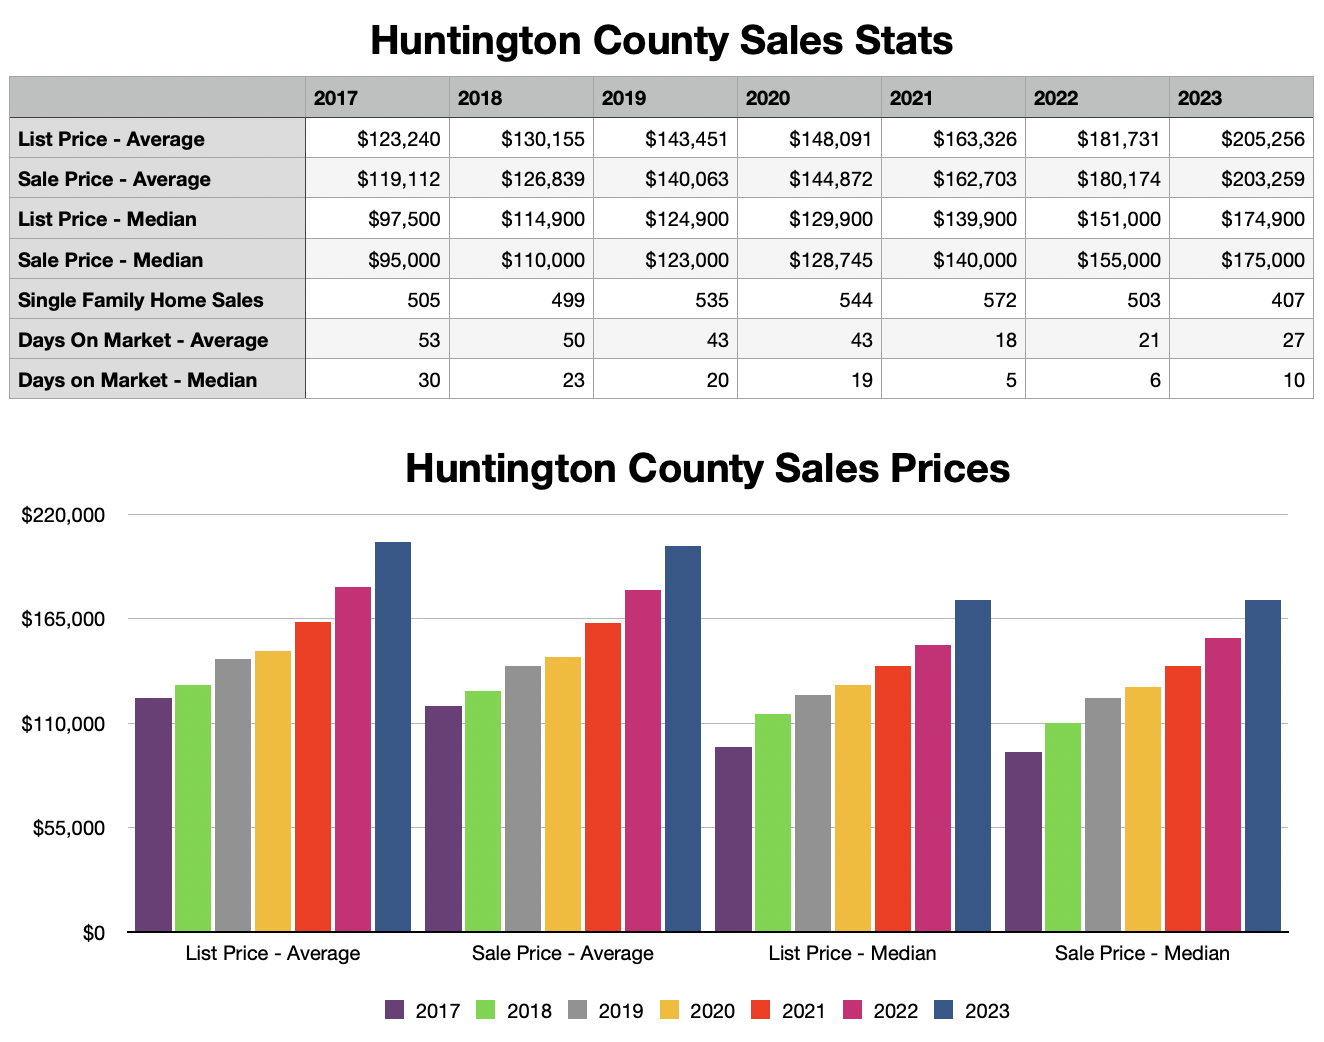
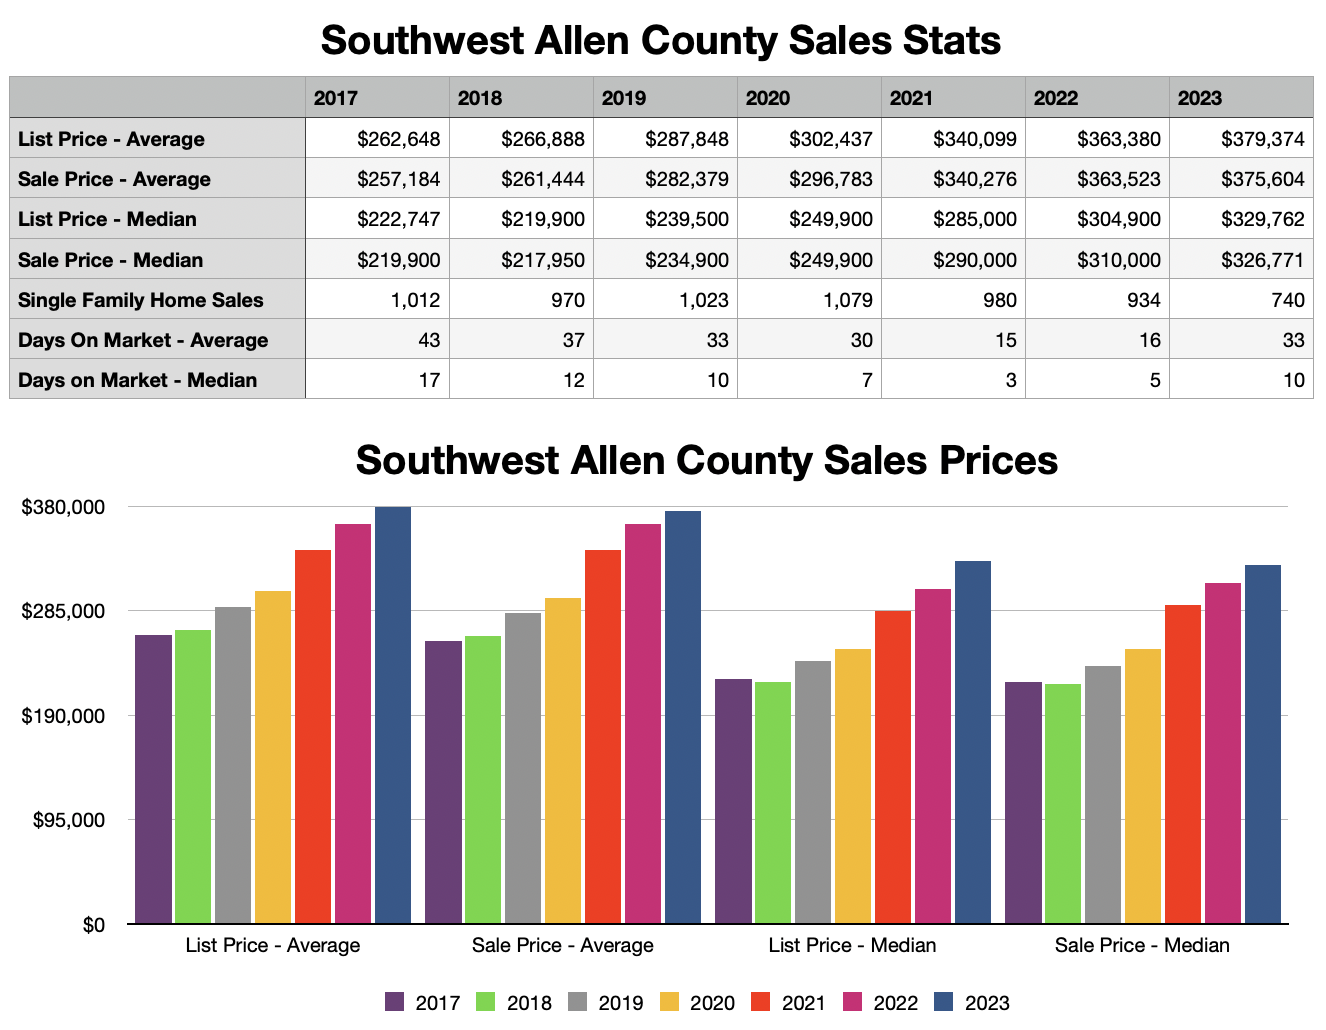
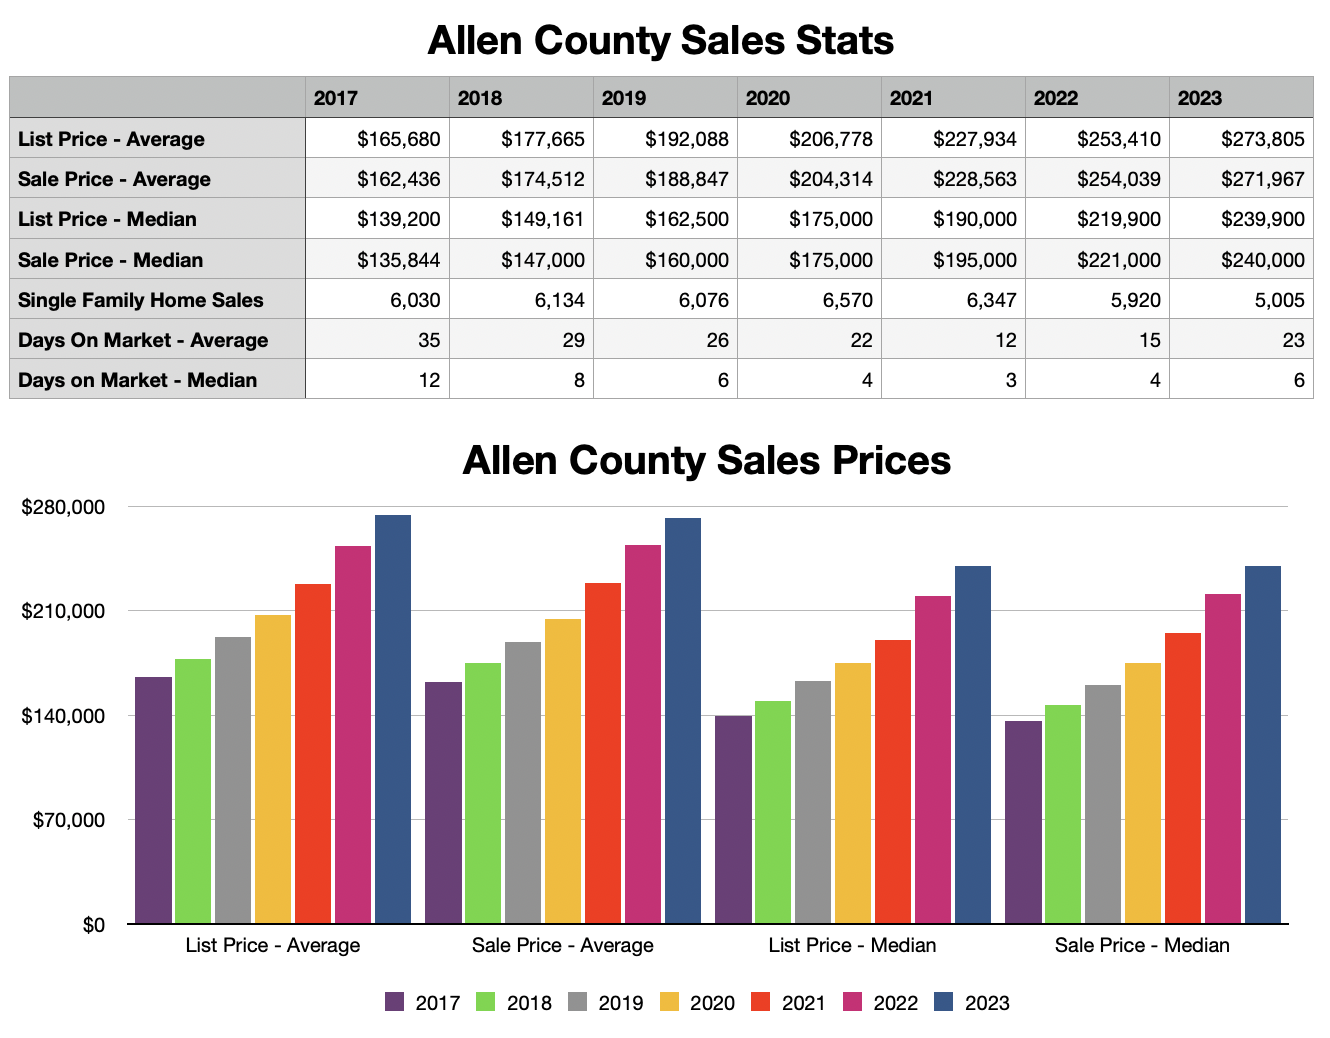
2023 - A Year in Review & Historical Comparison
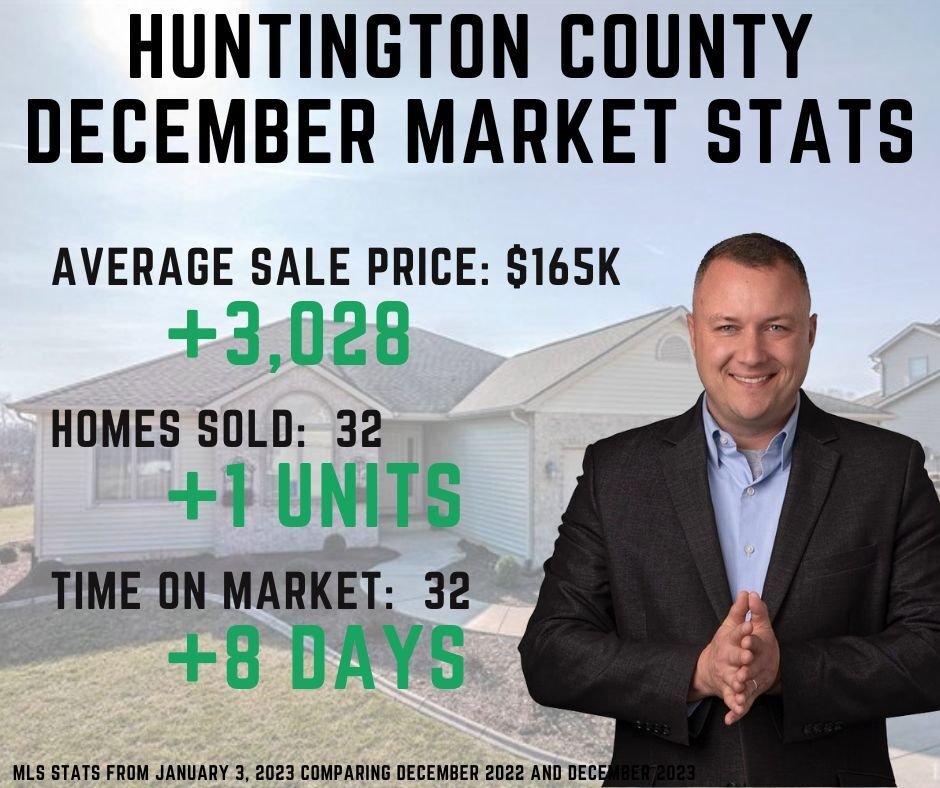
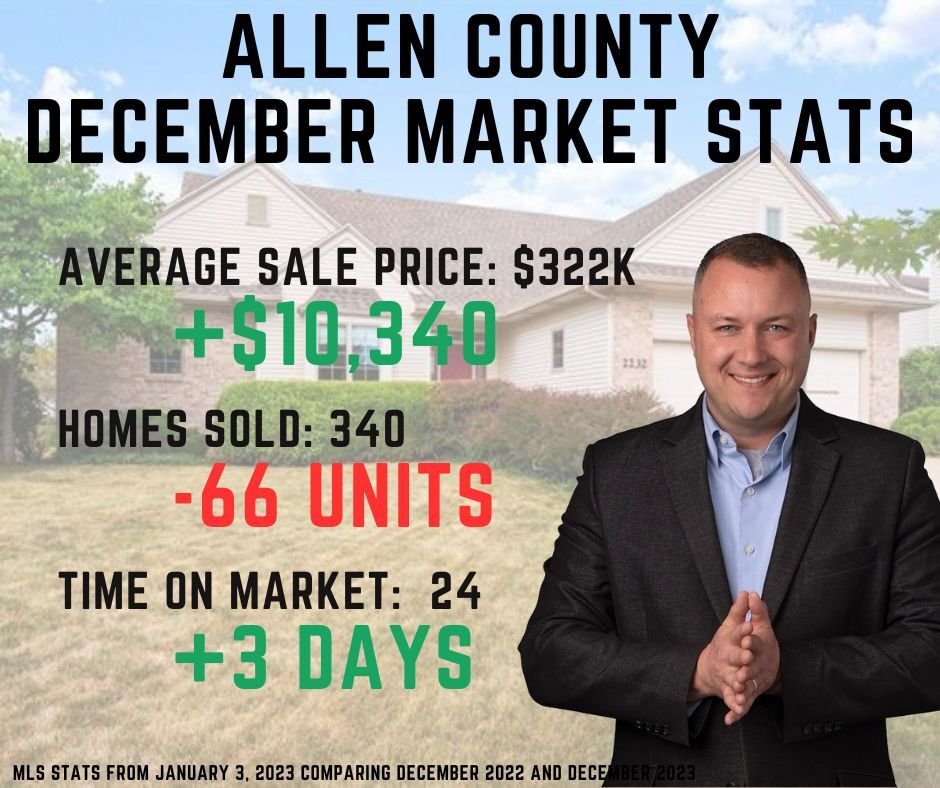
2023 December Stats

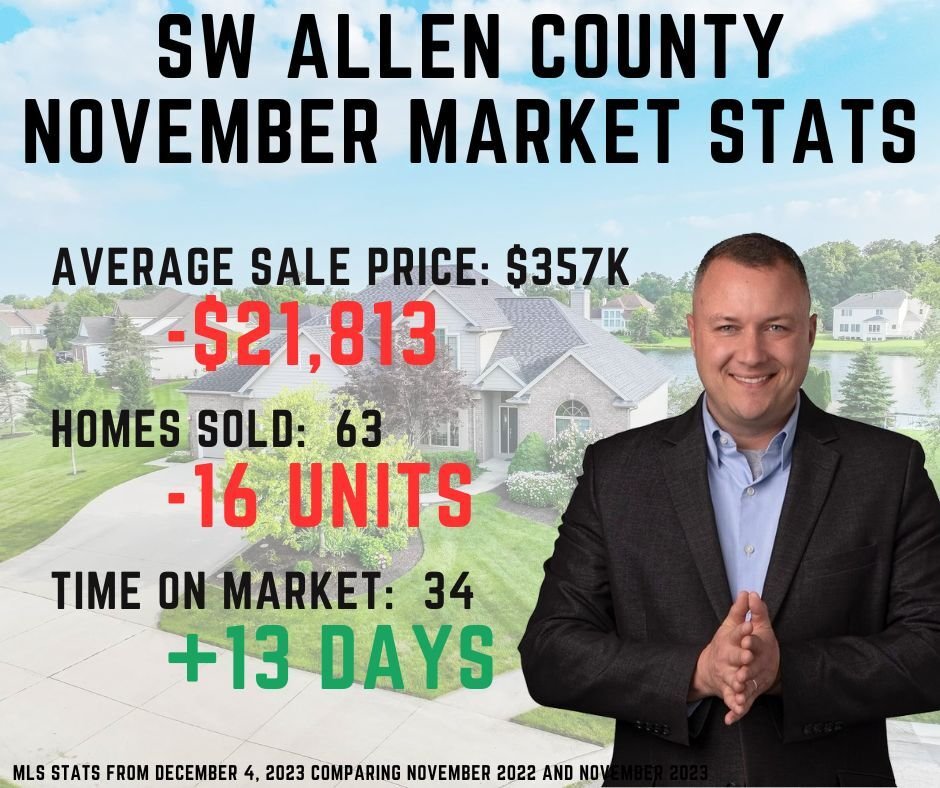
2023 November Stats


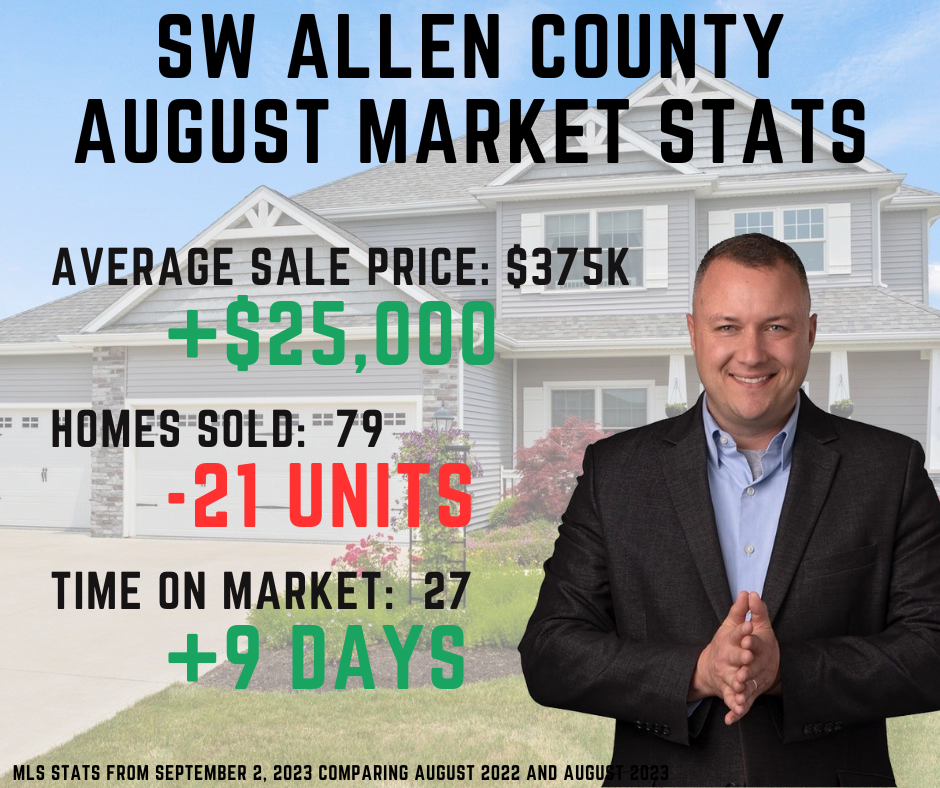
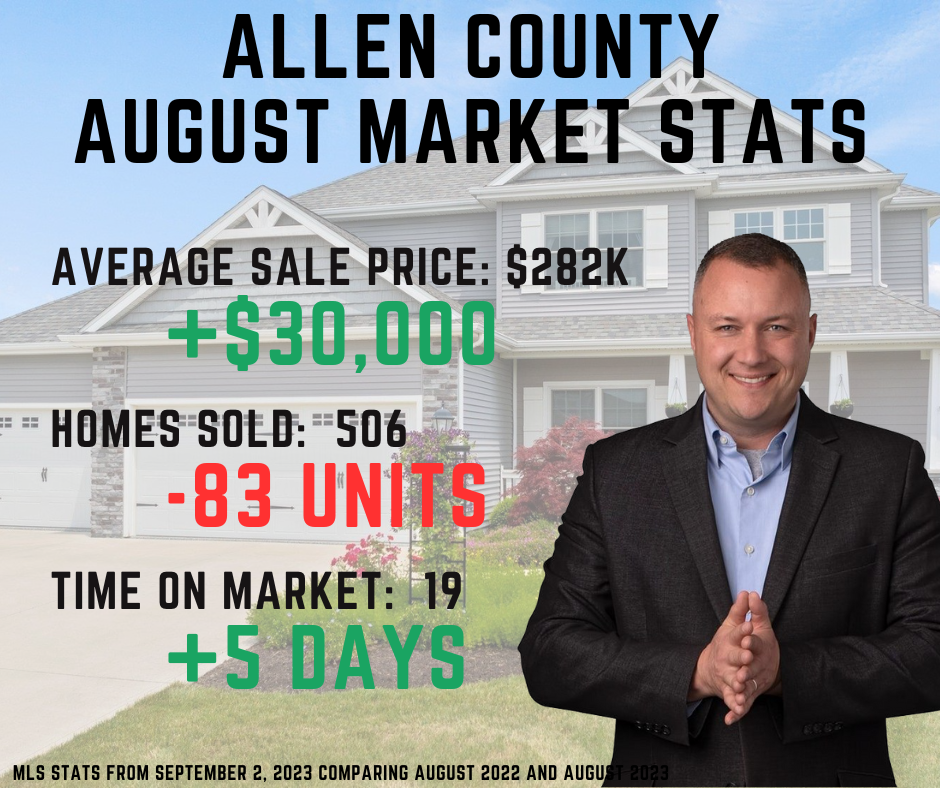
2023 August Stats

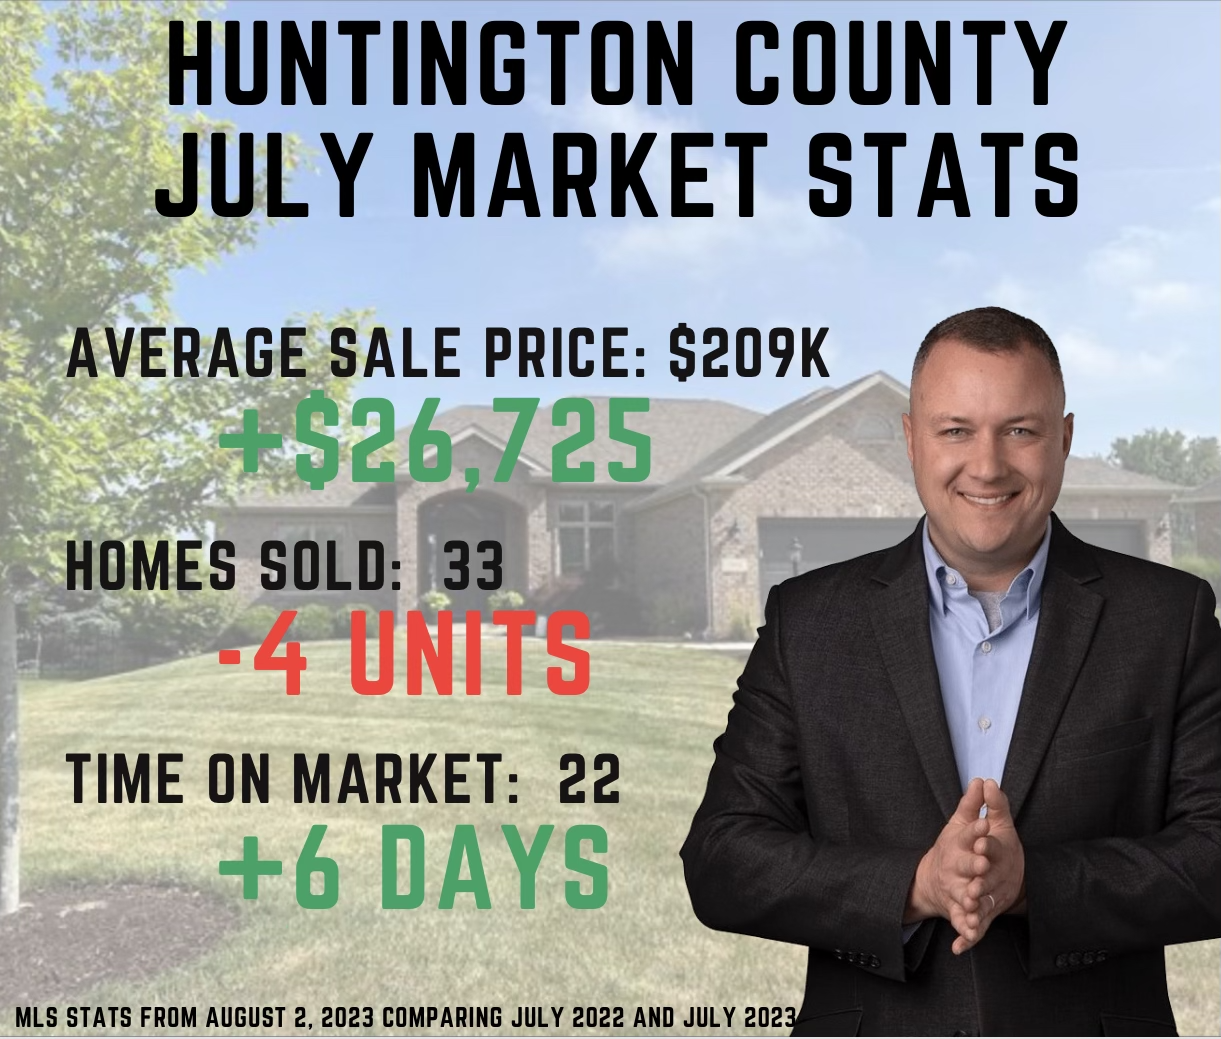
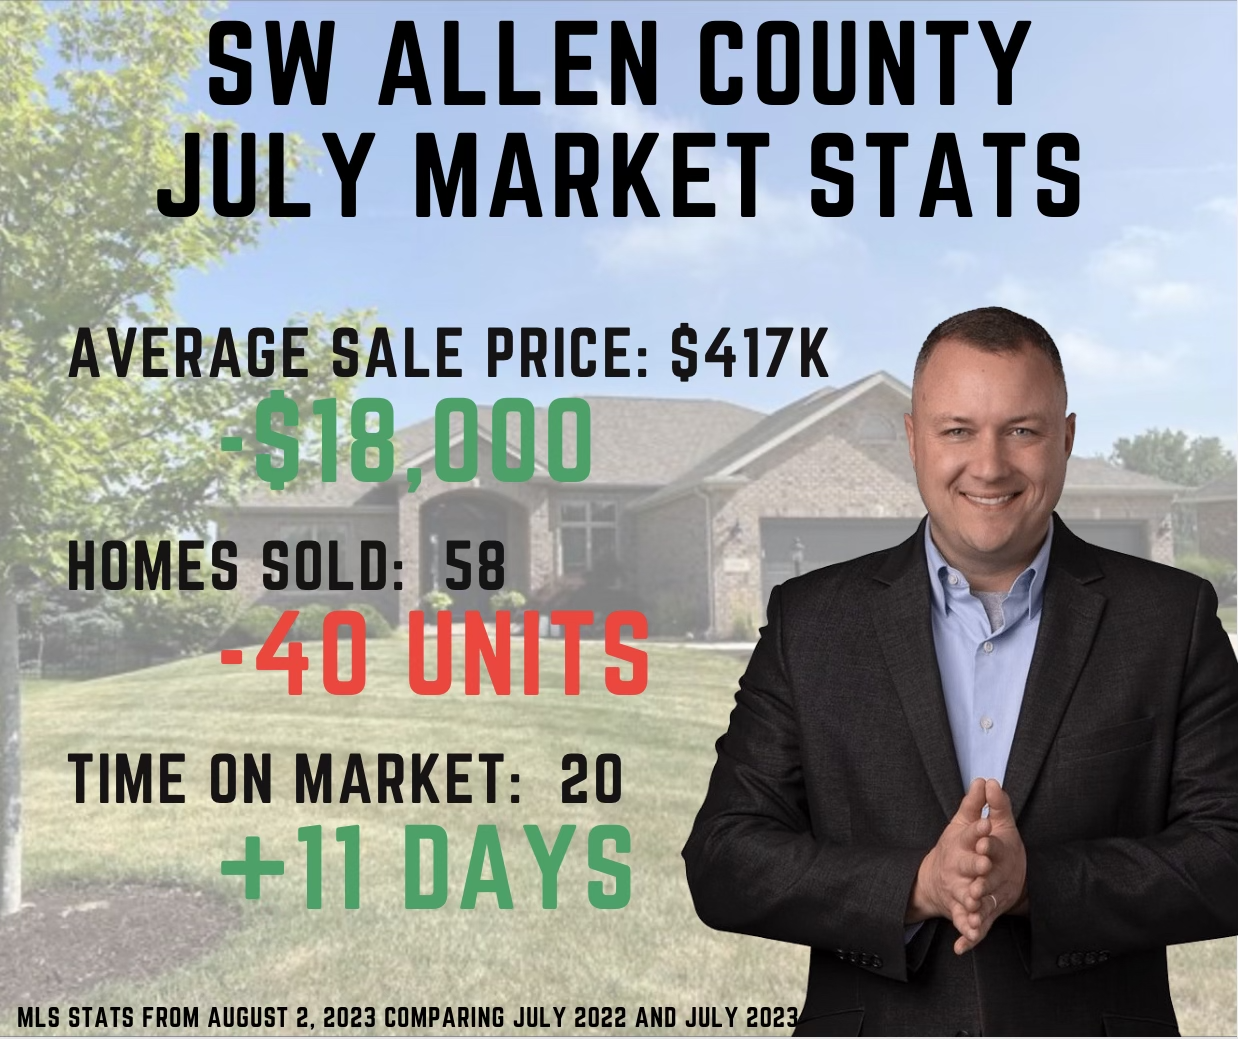
2023 July Stats

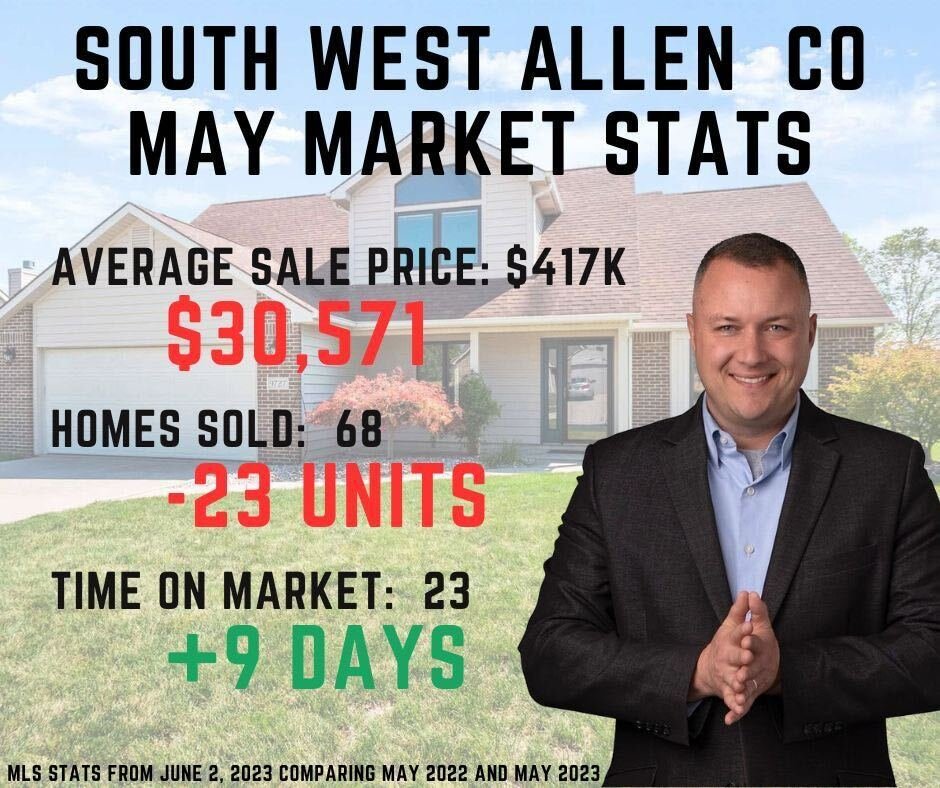
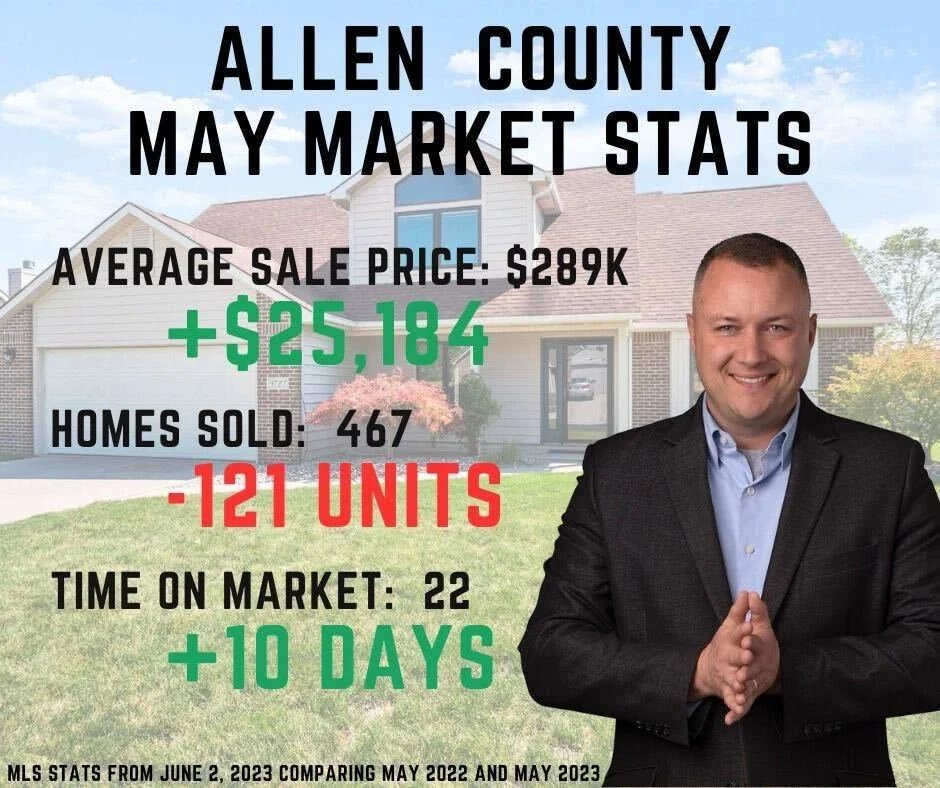
2023 May Stats

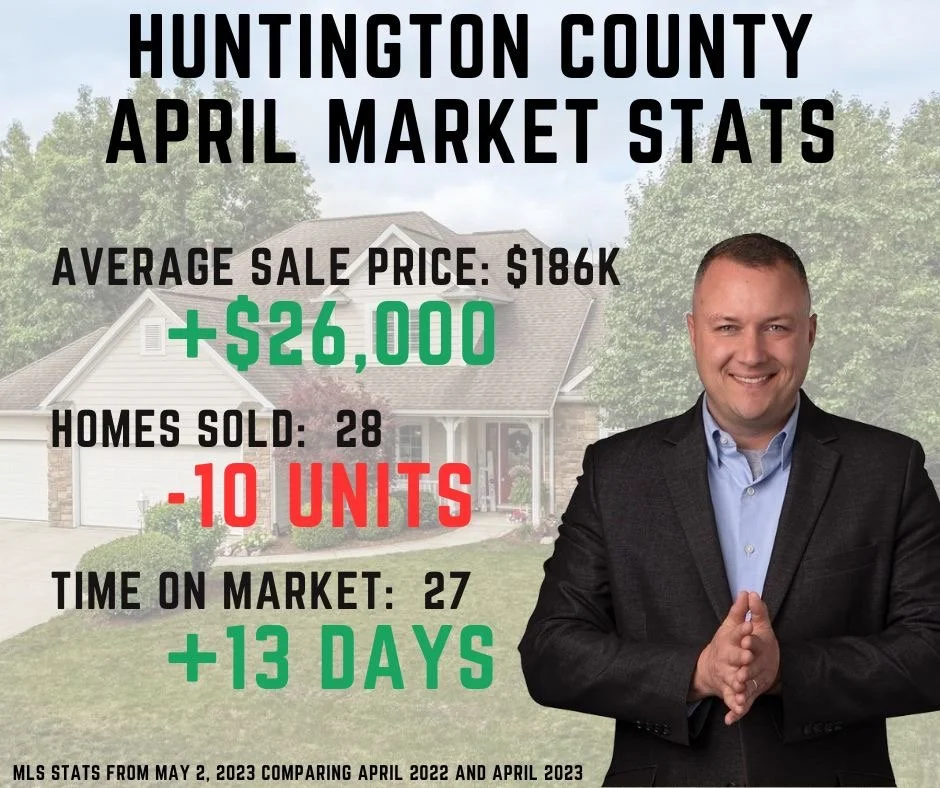
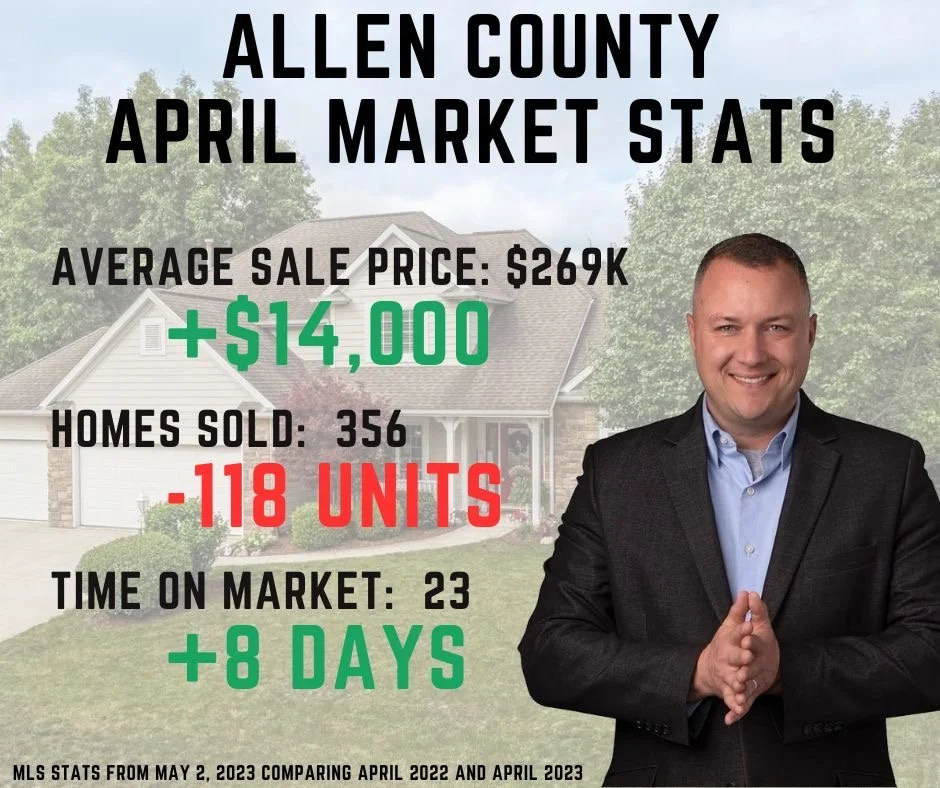
2023 April Stats

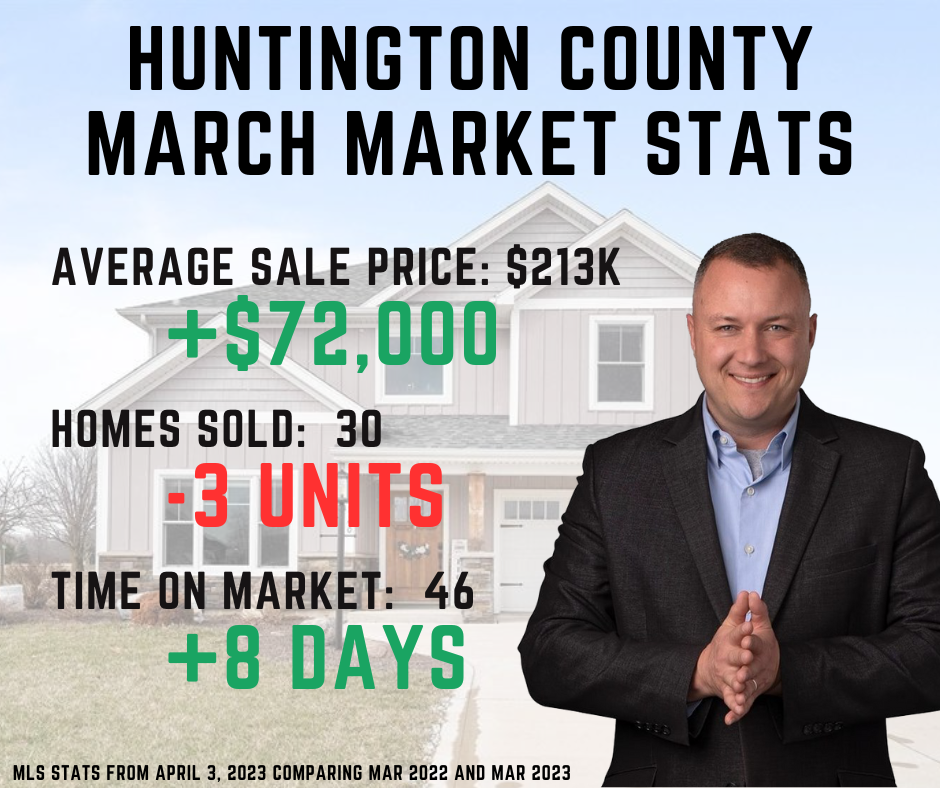
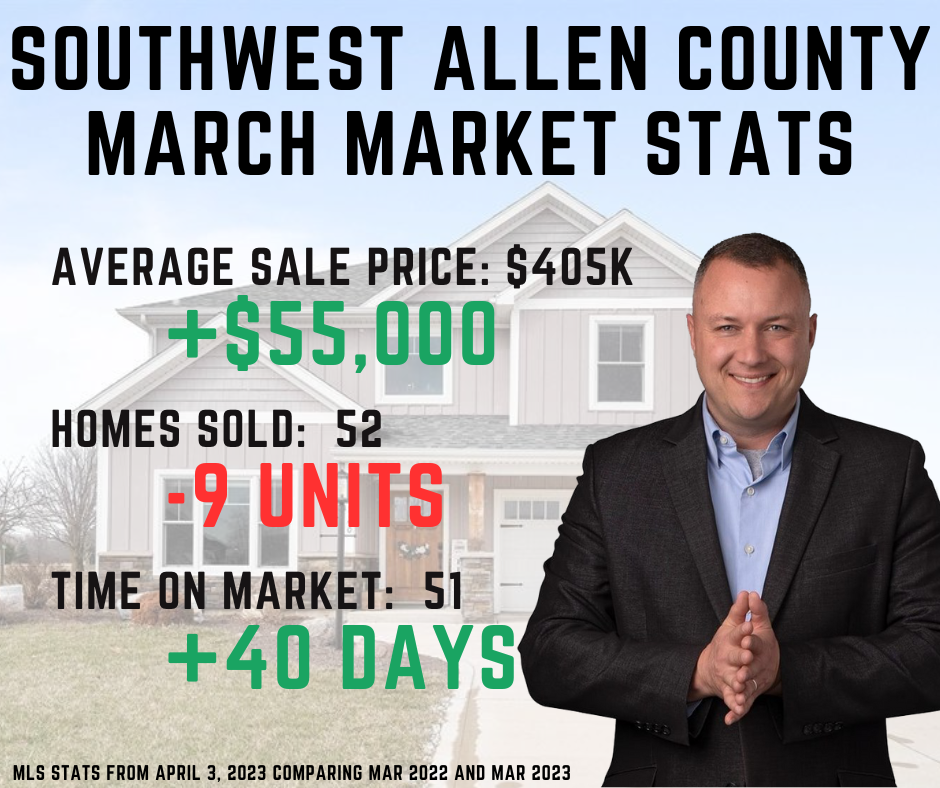
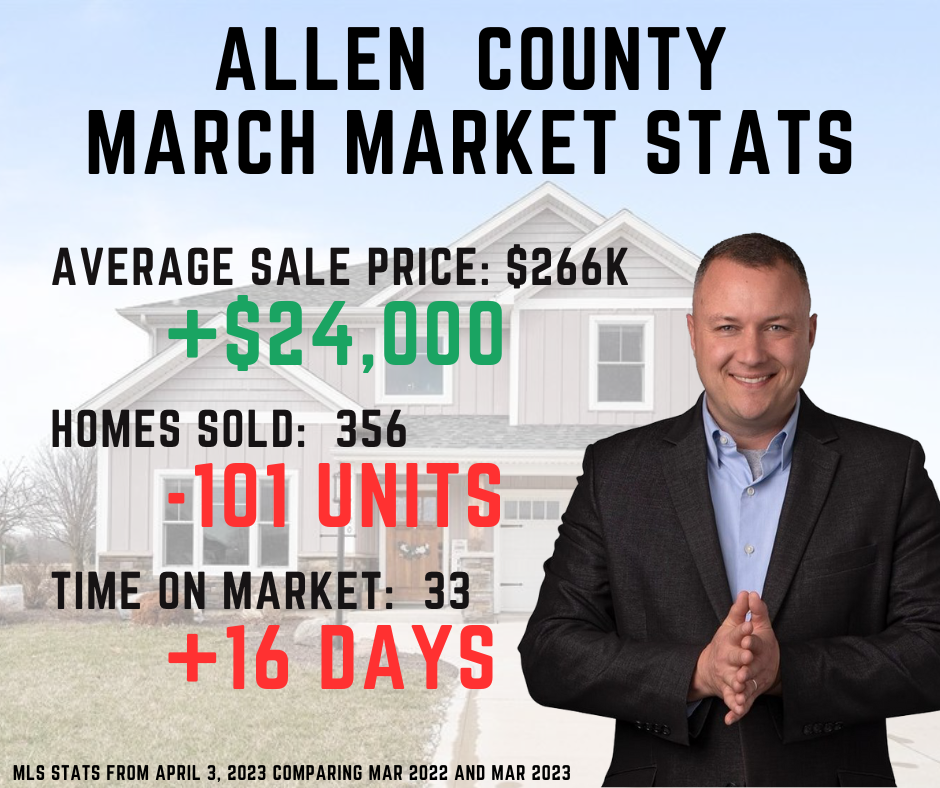
2023 March Stats
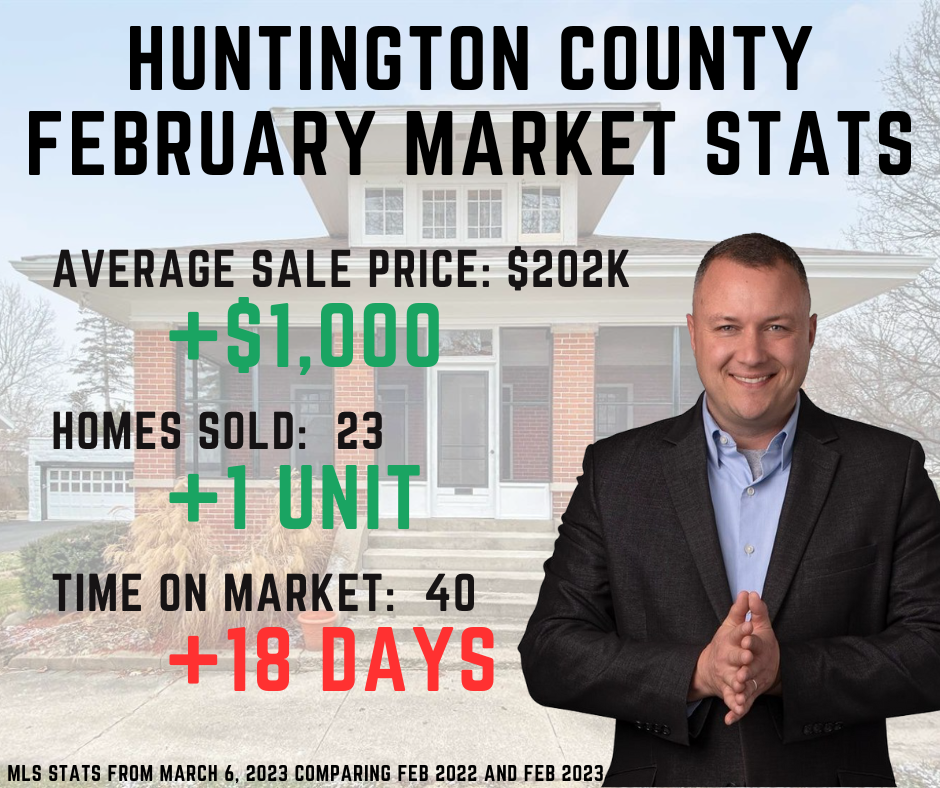
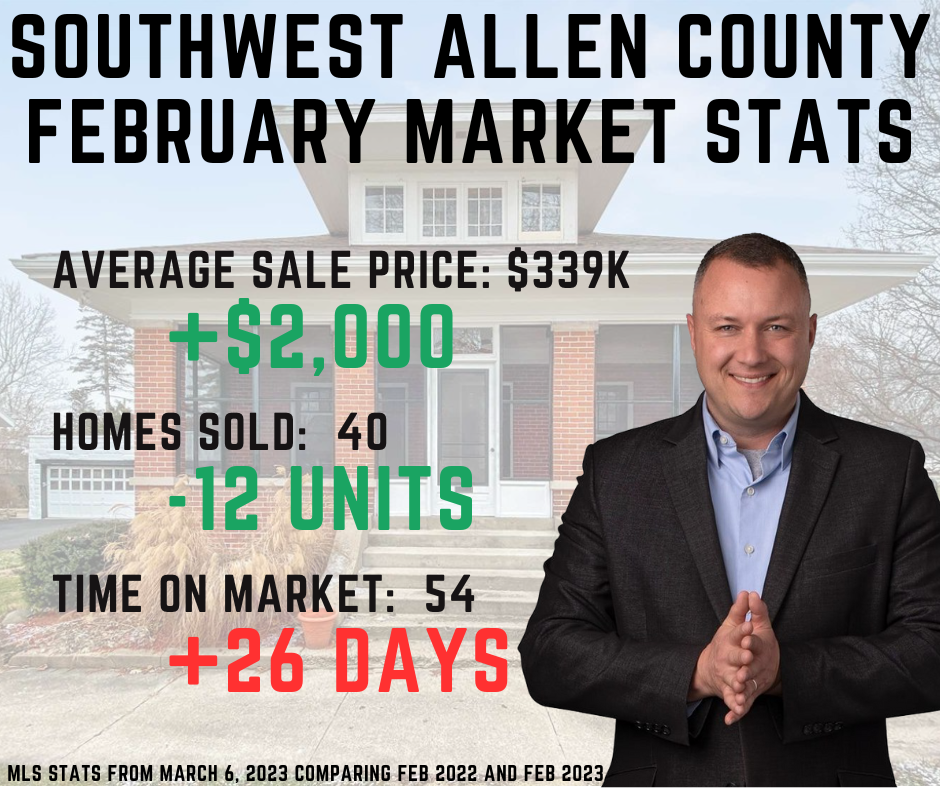
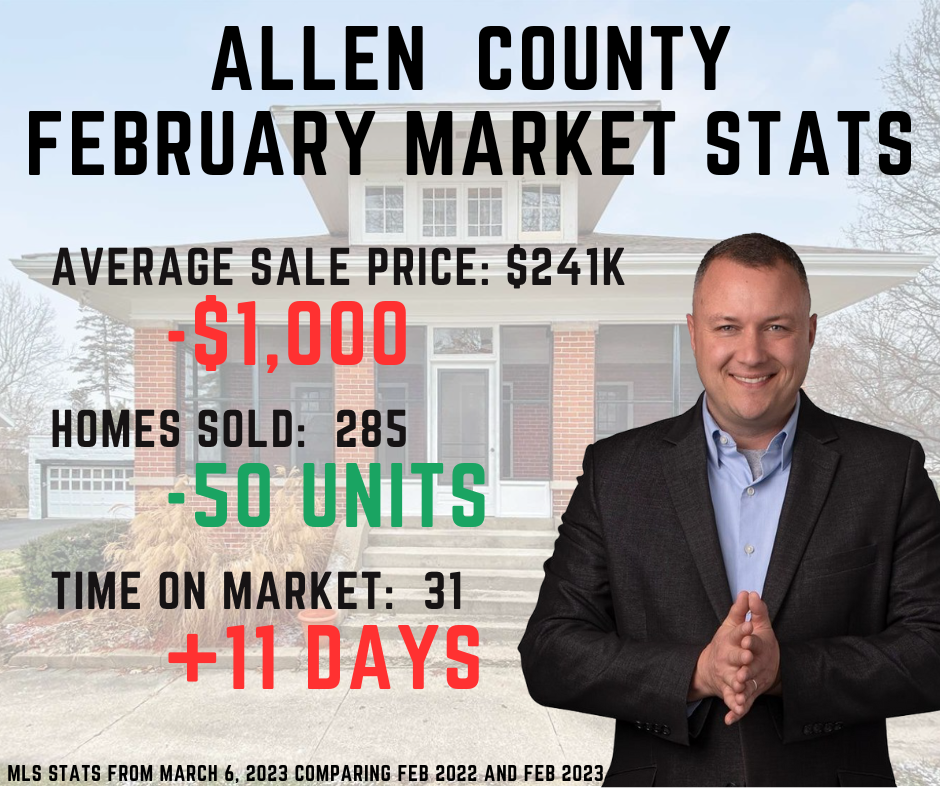
2023 February Stats
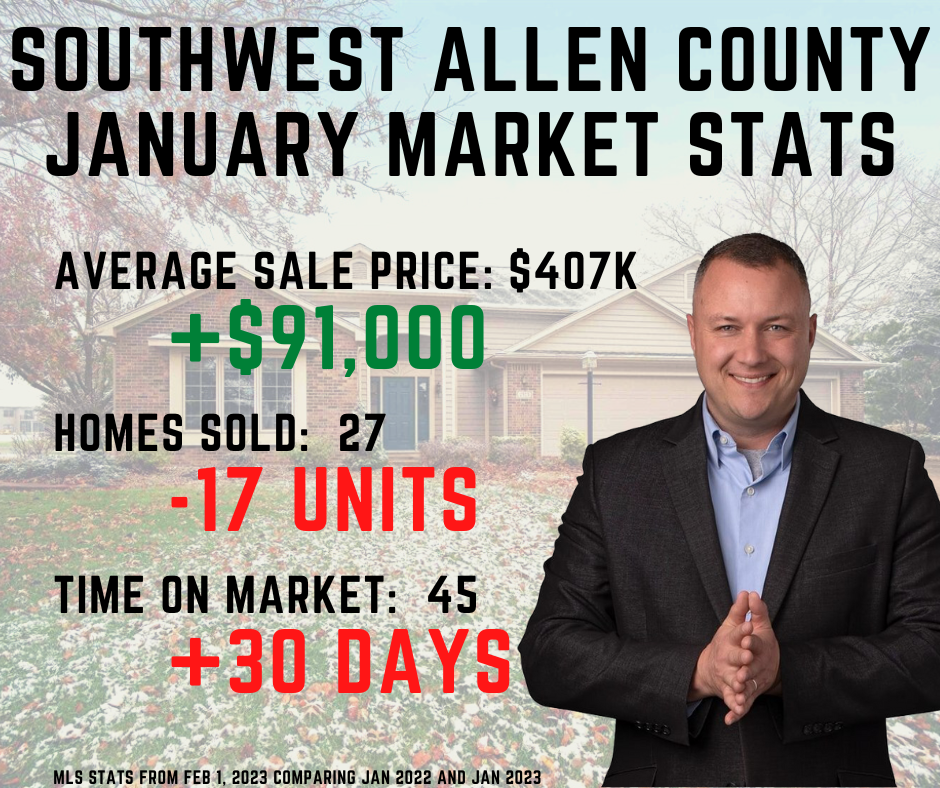
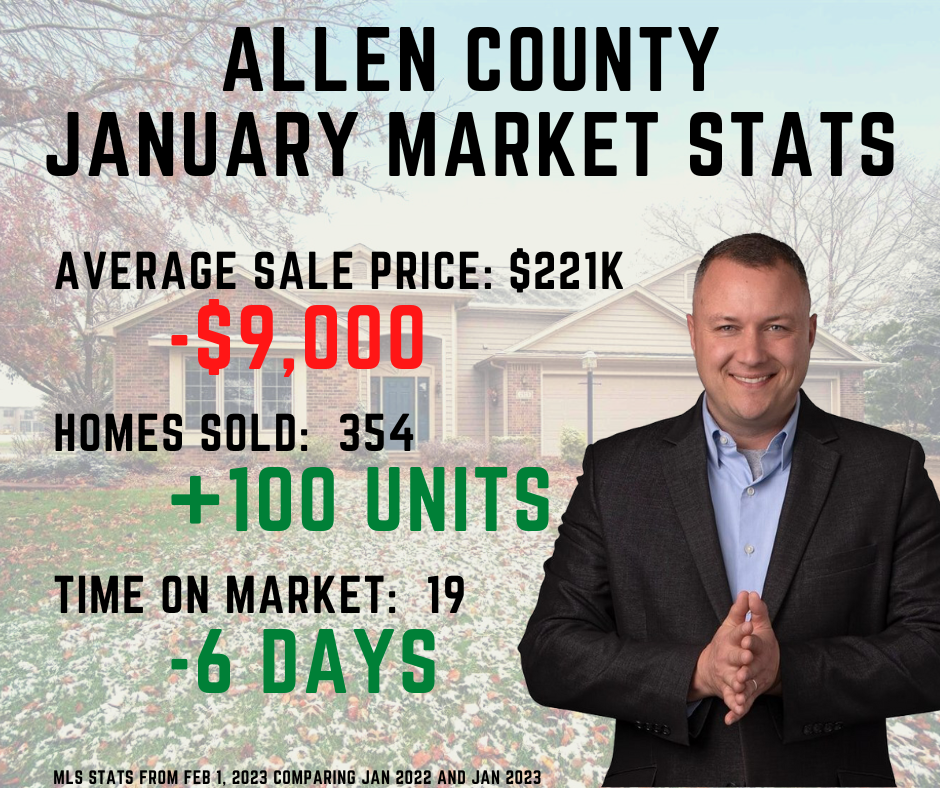
2023 January Stats

2022 vs 2021 - A Year in Review


The COVID-19 Era Housing Market
This chart represents the last three years of housing price trends for single family homes in the Indian Regional MLS. It’s interesting to see the rise of prices and the likelihood of a sale price over list. We see a traditional negotiation off of list price through spring of 2021 and then the market got turned upside down. Home prices peaked in the July 2022 and cooled with a rebalance of housing demand, seasonal slow-downs and skyrocketing Q3 interest rates.
I help sellers get the most amount of money, in the shortest amount of time with the least number of headaches. I help buyers get solid financing, the fastest access to inventory and negotiate the most favorable terms. If you have questions about how to satisfy your home needs, call/text me at 1-260-760-4589.

2022 October


2022 September


2022 August


2022 July


2022 June


2022 May


2022 April


2022 March


2022 February


2022 January


2021 VS 2020


2021 December


2021 November


2021 October


2021 September


2021 August


2021 July


2021 June


2021 May


2021 APRIL


2021 MARCH


2021 FEBRUARY


2021 JANUARY